What You Would Actually Earn as Passive Income
Article 1-8
What You Would Actually Earn as Passive Income
The numbers in this article are real. The Forbes Global 2000 companies had combined revenue of $52.9 trillion in FY 2024, which is roughly 48% of global GDP ($111.3 trillion). The two are not directly comparable — revenue is total sales while GDP is value-added — but the comparison conveys the scale: these 2,000 companies operate at a scale roughly half the size of the entire world economy by revenue, while contributing perhaps 25-35% of GDP.
The Forbes Global 2000 is the fund’s initial conceptual target, but the eventual scope is broader. Major private multinationals — Cargill, Koch Industries, Bechtel and similar — represent substantial additional economic activity that the fund would also seek to compete with.
If the fund owned companies in all global industries and distributed all profits equally: $598 per person per year.
The fund would reinvest 30-40% of profits into acquiring new companies rather than distributing everything immediately. This number is illustrative — in line with growth-stage public companies — but the actual percentage is for shareholders to decide. The reinvestment is what grows the dividend year on year. Additionally, shareholders would democratically vote on target profit margins: the current 9.3% average among all industries may come up or down depending on the industry and if the fund prioritizes fair consumer pricing over maximum exploitation.
The phased reality
The fund does not need to own everything to start paying dividends. As each phase of acquisition completes:
| Fund ownership | Annual dividend* |
|---|---|
| 25% of Global 2000 | ~$149 / person / year |
| 50% of Global 2000 | ~$299 / person / year |
| 100% of Global 2000 | ~$598 / person / year |
* Calculated at the current 9.3% all-industries average margin.
This calculation uses the current 9.3% including-all-industries average margin. Under fund policy — capping high-margin industries at 10% and leaving low-margin industries alone — the eventual margin would be somewhat lower, reducing the dividend by perhaps 10-15%. We accept this trade-off because it lowers consumer prices.
The timeline matters
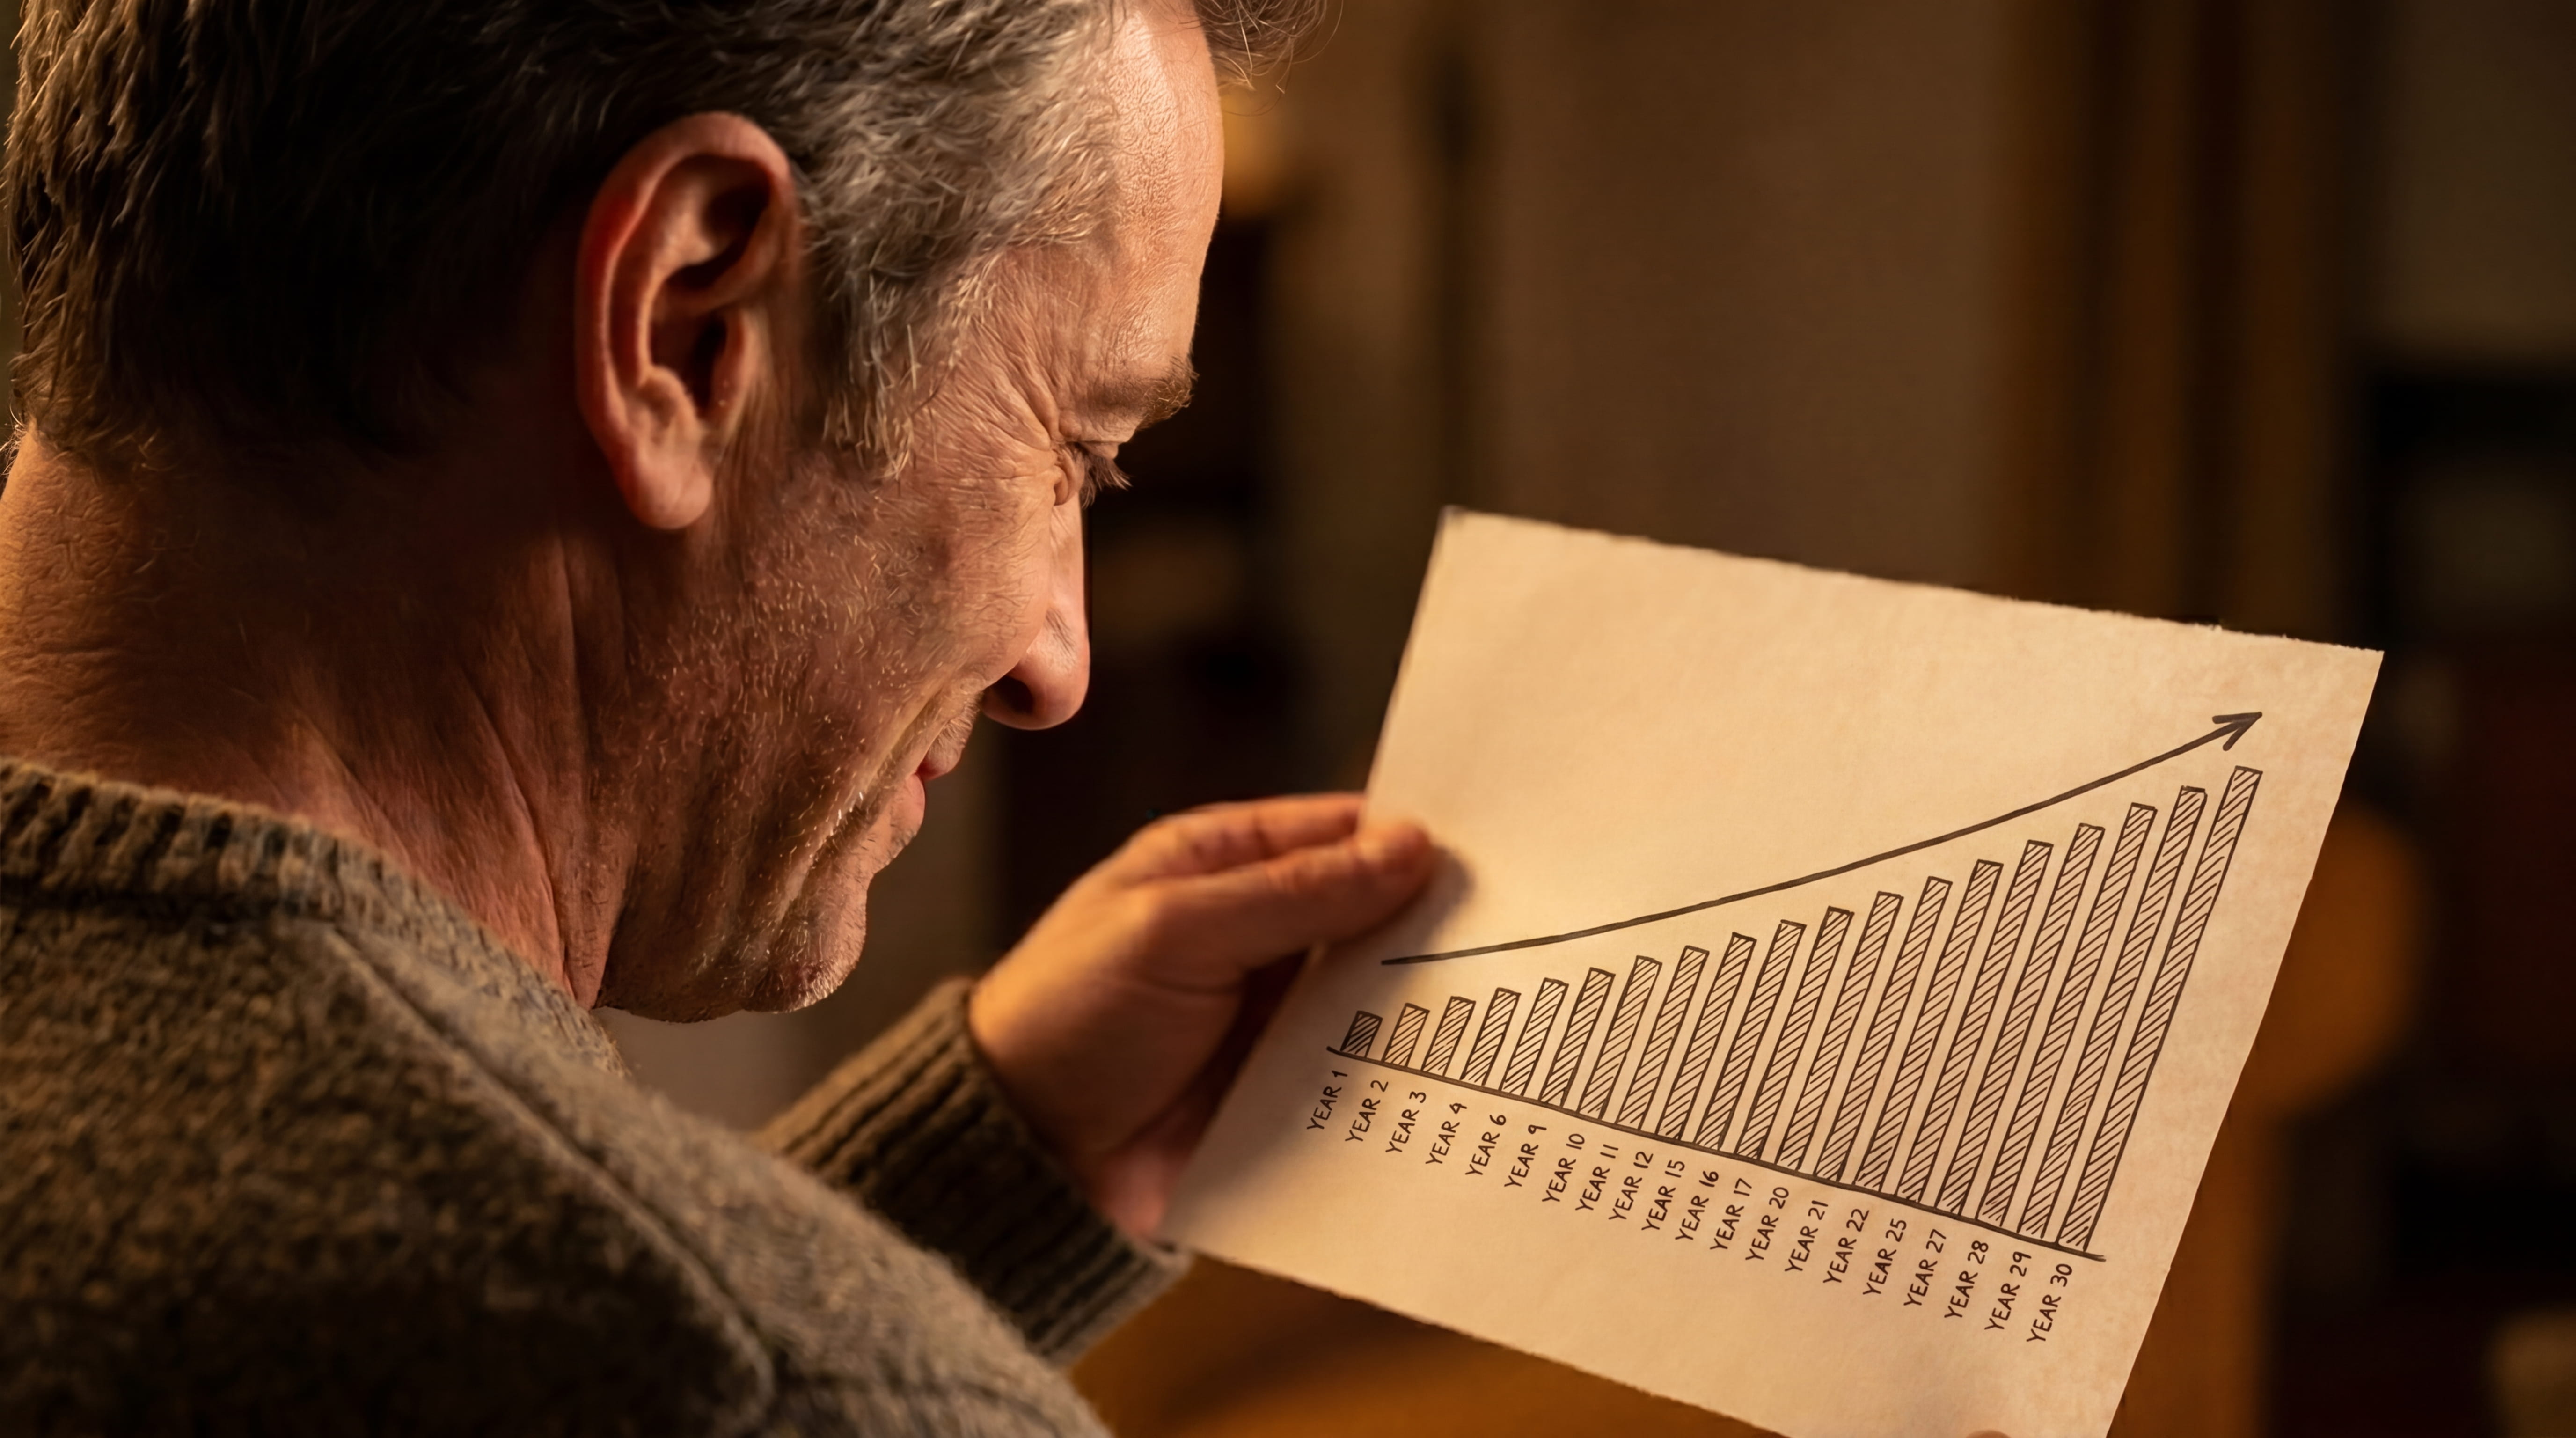
These ownership levels are not reached quickly. The first decade is the foundational period during which the fund grows from its first acquisitions to operating at roughly 2-5% of global productive activity — substantial but still far below the Global 2000 ownership thresholds shown in the table above. Dividends during the first decade grow from under $1 per member in Year 1 to roughly $25-33 per member by Year 10. The 25% ownership threshold (~$149 per member per year) is realistically a Year 15-20 outcome. The 50% threshold is Year 20-25. The 100% steady state is Year 25-30. The full trajectory is described in detail in Part 2 of this series.
Why these numbers matter
The global extreme poverty line was raised by the World Bank in June 2025 from $2.15 to $3.00 per day — approximately $1,095 per year (source: World Bank, “June 2025 Update to Global Poverty Lines”). At full ownership across industries, the dividend alone covers 55% of what it takes to lift someone out of extreme poverty, before counting any employment income or innovation royalties. For the roughly 838 million people currently living below this line — most of them in Sub-Saharan Africa — the difference, in many contexts, between a child attending school or going to work.
The global median income is approximately $2,000–3,000 per year. The dividend at full ownership represents an additional 30% on top of whatever people already earn.
The dividend grows
These numbers describe the fund’s position at a single point in time. As the fund reinvests profits, acquires new companies, and expands across industries, the profit pool grows every year. The Forbes Global 2000 itself illustrates this trend: combined profit grew 3.1x, market value 3.0x, and assets 3.2x over the past 20 years — while total sales grew only 1.4× (140% increase) in the same span. The largest global companies have become substantially more profitable per dollar of revenue, capturing an increasing share of the economic surplus they generate. Once the fund owns companies in all industries, that increasing share flows back to citizens rather than to concentrated shareholders. (source: Forbes Global 2000, 2025 edition).
Note also that the Forbes Global 2000 covers only publicly traded companies. Large private multinationals — significant players in agriculture, commodities, and logistics — are not counted here, meaning the eventual profit pool is larger than these figures suggest.
The $1 you invest today is not buying a fixed return — it is buying a compounding share of a global economy that the fund progressively owns more of. The dividend in Year 15 will be substantially larger than the dividend in Year 5.